- Registriert
- 13.01.19
- Beiträge
- 2
Hallo zusammen,
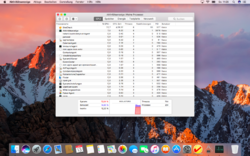
habe seit einer Woche ein Problem mit meinem MacBook Air (Mitte 2013; gekauft 2014). Es fing alles an vor ca. einer Woche an, plötzlich wurde der Laptop sehr laut, jedoch überhaupt nicht warm. Nachdem ich die Aktivitätsanzeige gestartet habe, konnte ich sehen, dass kernel_task eine CPU von 250 - 980 % hatte. Die untere Grafik (Auslastung) war mal sehr hoch, mal tief. Ich habe mich entschlossen, da das Zurücksetzen von PRAM und SMC nichts gebracht hat, ein Backup von meinem Mac zu machen und alles zu löschen und anschließend neu zu installieren. Jedoch auch das hat nichts gebracht, weiterhin CPU von 250 % und ein sehr langsamer Laptop. EtreCheck habe ich auch bereits durchgeführt, Protokoll füge ich anbei wie auch ein Screenshot von der Aktivitätsanzeige. Übrigens ist aktuell nichts weiter installiert bis auf Etrecheck.
Hat jemand vielleicht eine Idee, was ich noch ausprobieren könnte?
Danke im Voraus.
Security:
GatekeeperEnabled
System Integrity ProtectionEnabled
System Launch Agents:
[Not Loaded] 9 Apple tasks [Loaded] 184 Apple tasks [Running] 89 Apple tasks
System Launch Daemons:
[Not Loaded] 43 Apple tasks [Loaded] 177 Apple tasks [Running] 96 Apple tasks [Other] 2 Apple tasks
Internet Plug-ins:
QuickTime Plugin: 7.7.3 (installed 2017-07-15)
Time Machine:
Time Machine Not Configured!
Performance:
System Load: 90.00 (1 min ago) 78.74 (5 min ago) 36.48 (15 min ago) Nominal I/O speed: 3.64 MB/s
File system: 120.25 seconds (timed out)
Write speed: 291 MB/s
Read speed: 360 MB/s
CPU Usage: Type Overall System 64 % User 14 % Idle 23 %
Top Processes by CPU:
Process (count) CPU (Source - Location) Other processes 266.52 % (?)
EtreCheck 42.84 % (App Store)
Dock 0.18 % (Apple) SafariCloudHistoryPushAgent 0.06 % (Apple) SystemUIServer 0.02 % (Apple)
Top Processes by Memory:
Process (count) RAM usage (Source - Location) EtreCheck 395 MB (App Store)
iconservicesagent 84 MB (Apple)
System Information 80 MB (Apple)
loginwindow 69 MB (Apple)
Spotlight 61 MB (Apple)
Top Processes by Network Use:
Process Input / Output (Source - Location) apsd 6 KB / 8 KB (Apple)
mDNSResponder 6 KB / 4 KB (Apple) netbiosd 3 KB / 2 KB (Apple) SystemUIServer 0 B / 128 B (Apple) ntpd-wrapper 0 B / 48 B (Apple)
Virtual Memory Information:
Available RAM 2.08 GB Free RAM 94 MB
Used RAM 1.92 GB Cached files 1.99 GB Swap Used 0 B
Page 2
Katarzynas MacBook Air 2019-01-13
Software Installs (past 30 days): Install Date Name (Version) 2019-01-13 EtreCheck (5.1)
Diagnostics Information (past 7 days):
2019-01-13 11:16:15 Last Shutdown Cause: 3 - Hard shutdown
Directory /Library/Logs/DiagnosticReports is not accessible without Full Drive Access. End of report